[ 2006 | 2007 | 2008 | 2009 | 2010 | 2011 | 2012 | 2013 | 2014 | 2015 | 2016 | 2017 | 2018 | 2019 | 2020 | 2021 | 2022 | 2023 | 2024 ]
2014 Shelfwide Cruise: July 26 - August 3

Hypoxia ForecastPress Release
Daily LogMississippi River Discharge
Photo GallerySatellite Image
Cruise ParticipantsMarine Forecast
Dissolved Oxygen MapsAdditional Maps
Graphs
Graphs
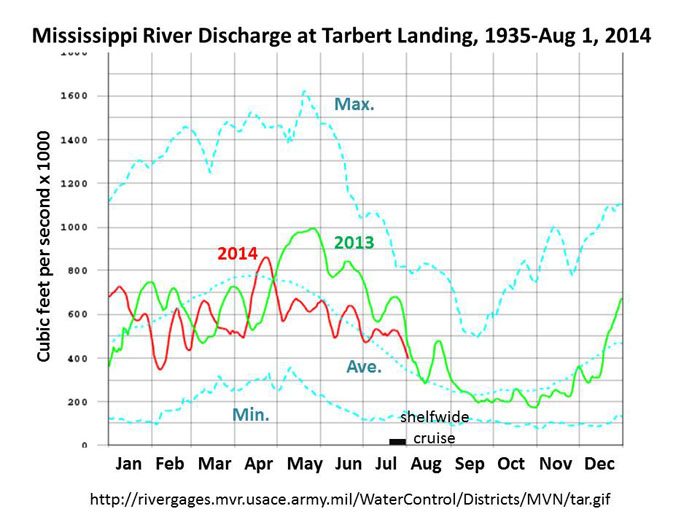 Mississippi River Discharge 2014 |
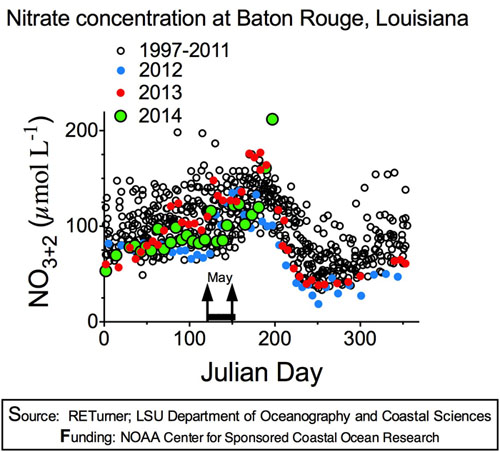 Nitrate in Baton Rouge 18 July 2014 |
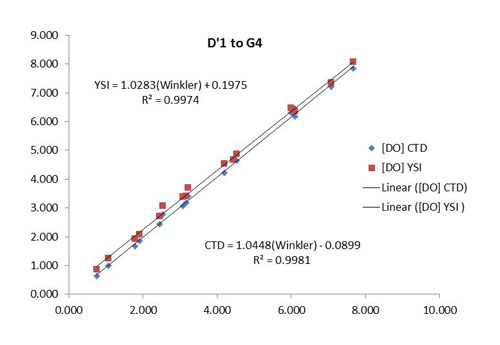 Oxygen Correction 2014 |
 Yearly size in sq km 2014 |
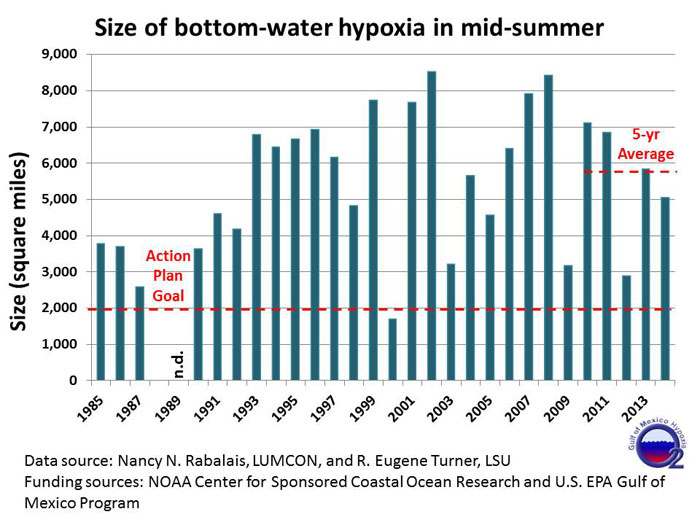 Yearly size in sq mi 2014 |
Disclaimer:
- The final dissolved oxygen data will be corrected, as necessary, from linear regression with the Winkler titrations over a range of 0.22 to 8.43 mg/L. Initial observations indicate correction, but the f-factor for the Winkler standard remains to be verified. Any corrected data will be reflected in other derived measurements.
- Salinity data not yet verified with PortaSal samples.
- CTD data remain to be post-processed with ALIGN CTD to be applied.
- Instrumentation was calibrated pre- and post-cruise according to manufacturer's specifications and standard method procedures were applied for several variables, not yet calculated, according to several LUMCON EPA-approved Quality Assurance Project Plans.
- Data collected as part of process studies remain to be analyzed and synthesized.
- Final QA/QC'd data will be submitted to NOAA NODC within two years of collection.