Frequency of Hypoxia (1985-Present)
The figure below shows the station locations that were found to be the most frequently hypoxic during the shelfwide cruises over the past 37 years. We reviewed the bottom oxygen values recorded at each station during a particular year and counted that station as hypoxic if the bottom dissolved oxygen was < 2mg/l. Frequency was calculated as the number of years a station was hypoxic over the total number of years that station was visited. Stations visited less than three years were not included in this analysis.
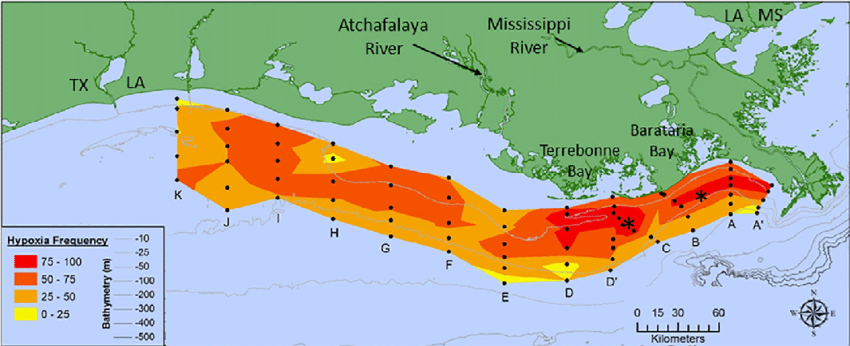
The frequency of bottom-water hypoxia from shelf-wide hypoxia mapping (1985-2014) (updated from Rabalais et al. (2007b); frequency is determined from stations for which there are data for at least half of all cruises. Stations are marked with black dots on the map. Asterisks (*) indicate locations of near-bottom oxygen meters; transects C and F identified. Data source: N. N. Rabalais and R. E. Turner.