Summer Hypoxic Zone Size Will Be Large
By Drs. Nancy Rabalais and R. Eugene Turner18 June 2013
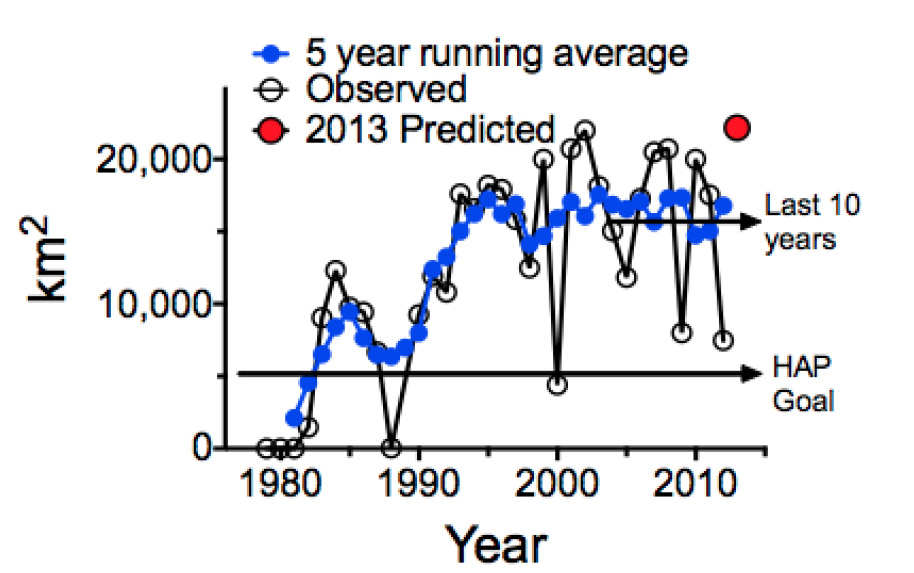
The June 2013 forecast of the size of the hypoxic zone in the northern Gulf of Mexico for July 2013 is that it will cover 22,172 km2 (8,561 mi2) of the bottom of the continental shelf off Louisiana and Texas. The area, if it reaches the predicted size, will be at or near the largest size since routine monitoring of the ‘Dead Zone’ off Louisiana and Texas began in 1985. The predicted hypoxic area for 2013 is about the area of New Jersey.
Each year a hypoxic water mass with oxygen concentrations < 2 mg l-1 forms in bottom waters of the northern Gulf of Mexico continental shelf. The low oxygen conditions threaten living resources including humans that depend on fish, shrimp and crabs. Nutrients from the Mississippi River watershed, particularly nitrogen and phosphorus, fertilize the surface waters to create excessive amounts of algal biomass, whose decomposition in the bottom layer leads to oxygen distress and even organism death in the Gulf’s richest waters.
The area in summer 2012 was 7,480 km2 (2,889 mi2) following a drought in the Mississippi River watershed and stormy conditions during the monitoring cruise. Hypoxic conditions are dependent on river discharge because of the influence that water volume and salinity have on the physical structure of the water column and on the nutrient load delivered to the coastal zone. The Mississippi River discharge in May 2013 averaged 36,700 m3 s-1, which is the 13th highest from 1968 to 2013. This is above average, but not particularly high.
The daily river discharge at Tarbert Landing from 1935 through 6 Jun 2013. Units are cubic feet per second. Figure modified from http://www2.mvn.usace.army.mil/eng/edhd/tar.gif.
The concentration of nitrite+nitrate (NO2+3) at Baton Rouge, La from 1997 to 2013. The data for 2012 and 2013 are shown separately. Unpublished data from Turner et al.
The measured and estimated size of the hypoxic zone from 1979 to 2012 and the predicted size for 2013. HAP is the goal of the Hypoxia Action Plan (2001, 2008)—5,000 km2 by 2015.
The cruise from which the 2013 map is created and the bottom area estimate calculated will take place from July 21-28. These data will be posted at http://www.gulfhypoxia.net. Information on previous summer cruises can be found there. The map from 2012 is below.
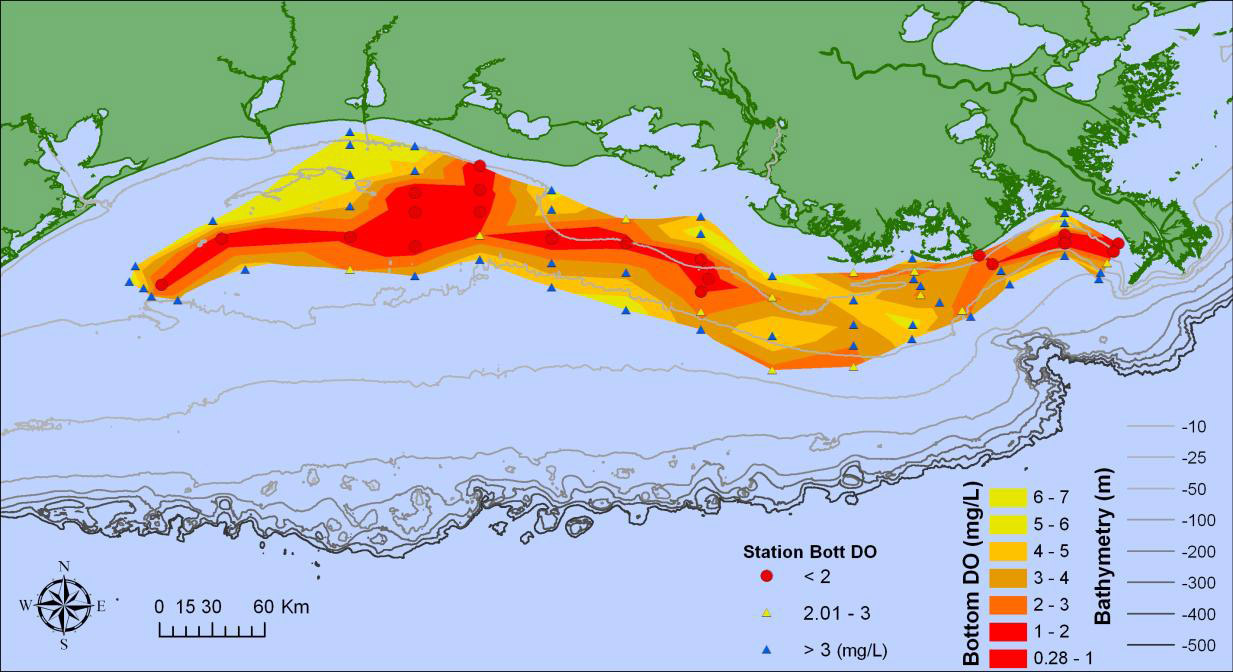
Oxygen concentrations in bottom-water across the Louisiana-Texas shelf from July 22-27, 2012. Data source: N.N. Rabalais, Louisiana Universities Marine Consortium, and R.E. Turner, Louisiana State University.
Nancy N. Rabalais (LUMCON, nrabalais@lumcon.edu)
R. Eugene Turner (LSU, euturne@lsu.edu)
Funding for the forecast models and the Gulf of Mexico hypoxia assessment comes from the National Oceanographic and Atmospheric Administration, Center for Sponsored Coastal Ocean Research.