[ 2006 | 2007 | 2008 | 2009 | 2010 | 2011 | 2012 | 2013 | 2014 | 2015 | 2016 | 2017 | 2018 | 2019 | 2020 | 2021 | 2022 | 2023 | 2024 | 2025 | 2026 ]
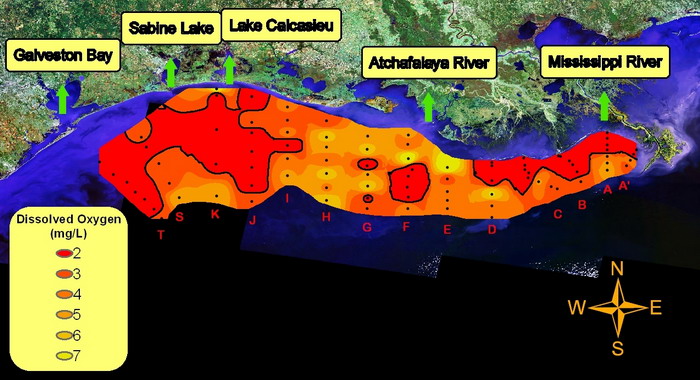
2010 Shelfwide Cruise: July 24 - July 31

Hypoxia ForecastPress Release
Daily LogMississippi River Discharge
Photo GallerySatellite Image
Cruise ParticipantsMarine Forecast
Additional MapsInteractive Google Map
Oil Spill MapsGraphs
Research Objectives
- Mapping the extent of hypoxic water (< 2mg/L) across the Louisiana and Texas inner to mid continental shelf, along with associated physical, chemical and biological parameters. Associated rate measurements of biogeochemical processes.
Projects
- Oxygen isotopes, respiration measurements
- POC/PONspatial distribution;
- Primary production with C14, nitrogen cycling with N15
- Surface pCO2, alkalinity, pH, DIC; bottom water alkalinity, pH
- Microassays for nutrient limitation of phytoplankton growth and microbial fingerprinting of substrates, surface and bottom water
- Benthic foraminiferal distributions and assessment of living individuals (stating techniques) with depth in sediment cores
- Sediment cores for paleoindicators of productivity and oxygen stress
- Potential collection of water column and sediments for petroleum hydrocarbons
Principal Investigators
- Nancy Rabalais, Louisiana Universities Marine Consortium
- Brian Roberts, Louisiana Universities Marine Consortium
- Geoff Sinclair, Louisiana Universities Marine Consortium
- Dubravko Justic, Louisiana State University
- Chunyan Li, Louisiana State University
- Brian Fry, Louisiana State Unviersity
- Don Scavia, University of Michigan
Funding
National Oceanic and Atmospheric Administration, Center for Sponsored Coastal Ocean Research, NGOMEX09: Integrated Ecosystem Modeling of the Causes of Hypoxia (Rabalais et al.), grant numbers NA09NOS4780204 to Louisiana Universities Marine Consortium and NA09NOS4780230 to Louisiana State University.
Disclaimer: Data Quality Control and Quality Assurance
- The final dissolved oxygen data will be corrected, as necessary, from linear regression with the Winkler titrations over a range of 0.22 to 8.43 mg/L. Initial observations indicate correction, but the f-factor for the Winkler standard remains to be verified. Any corrected data will be reflected in other derived measurements.
- Salinity data not yet verified with PortaSal samples.
- CTD data remain to be post-processed with ALIGN CTD to be applied.
- Instrumentation was calibrated pre- and post-cruise according to manufacturer's specifications and standard method procedures were applied for several variables, not yet calculated, according to several LUMCON EPA-approved Quality Assurance Project Plans.
- Data collected as part of process studies remain to be analyzed and synthesized.
- Final QA/QC'd data will be submitted to NOAA NODC within two years of collection.
