Eutrophication: Mapping the first steps that lead to dead zones
By RTSea Blog19 March 2011
Dead Zones – an alarming term used to describe aquatic areas where oxygen levels are so greatly reduced as to push out or kill most fish, plants, and shellfish. It’s a dramatic descriptor for the extreme end result of two much more complex processes: eutrophication and hypoxia. While both of these can occur naturally, they are also increasing with greater frequency due to man-made causes.
Eutrophication is the introduction of natural or artificial substances, such as nitrates or phosphates, into an aquatic system. Sometimes this can be due to natural occurrences – such as runoff from rains that include a high percentage of decaying plant matter or animal waste. This has been known to occur in some lakes and rivers, particularly in areas of the world where seasonal changes can be extreme – long droughts followed by heavy rains.
 However, eutrophication is often caused by the introduction of fertilizers and treated or untreated sewage. And when this happens there begins a series of cascading disturbances that can ultimately lead to a dead zone. Everything from increased nitrogen which upsets the proper balance of dissolved nitrogen and oxygen levels; the expanded growth of algae and phytoplankton which can reduce sunlight, upsetting the process of photosynthesis that produces oxygen and impacting bottom dwelling creatures; a feedback loop that is generated by more decaying plant material from the increase algal growth – all begin to enter into the picture at varying degrees.
When dissolved oxygen levels are reduced to the point at which a wide swath of animal and plant life is severely impacted, then you have a hypoxic or low-level oxygen condition. This can lead to a major shift in the aquatic ecology through either the migration or elimination of species or by predation from animals than can better withstand or even prefer low-oxygen environments. Another offshoot can be the development of toxic bacteria, which has been linked as a possible culprit in a recent die-off off hundreds of thousands of sardines in Redondo Beach, California. While not yet determined to be the definitive culprit, the overall water condition outside the harbor in Redondo Beach is being scrutinized as a polluted, low oxygen area that may have allowed for a large mass of sardines to be affected by neuro-toxin bacteria.
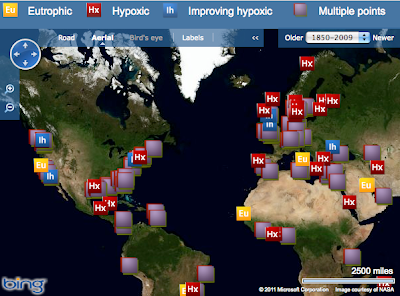
The World Resources Institute (WRI) has been compiling evidence of eutrophication and hypoxia on a global scale for some time. WRI provides an interactive map whereby one can view areas of either or both of these conditions. It also includes areas that have actually shown improvement, which means thatthis is a process that can be reversed.
While it is true, as mentioned earlier, that eutrophication and hypoxia can be a naturally-occurring process, by using the map’s time frame feature – where you can select segments of time in years ranging back to 1850 – one can see the increase in these conditions over the years. Currently, the World Resources Institute lists 762 impacted coastal areas, 228 effected by eutrophication and 479 effected by hypoxia. Fifty-five areas show improvement. The institute is constantly searching for information on scientifically-verified sites so as to provide as accurate of a picture as possible.
Aquatic ecology has its ups and downs, its own ways of pummeling itself and then recovering – something it developed over hundreds of thousands of years. But today there is clear evidence that mankind is throwing unexpected blows from which the oceans, lakes, and rivers are unable to recover. Better control of our use of fertilizers and our disposal of sewage and other chemicals is the obvious solution, but it requires the political will, economic incentive, and public support to produce positive action.
http://rtseablog.blogspot.com/2011/03/eutrophication-mapping-first-steps-that.html