NOAA | 31 July 2025
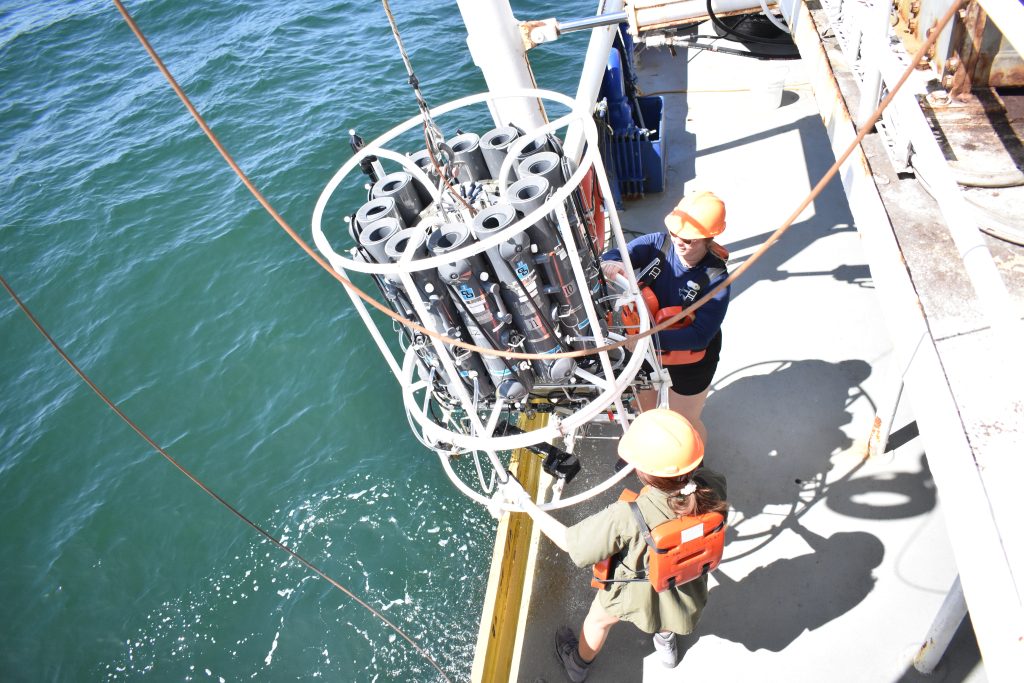
Students Abby Roche and Lily Tubbs retrieve the CTD (conductivity, temperature, depth) sensor package after profiling dissolved oxygen at a station on the Shelfwide Hypoxia Cruise. (Image credit: Courtesy of Cassandra Glaspie/LSU )
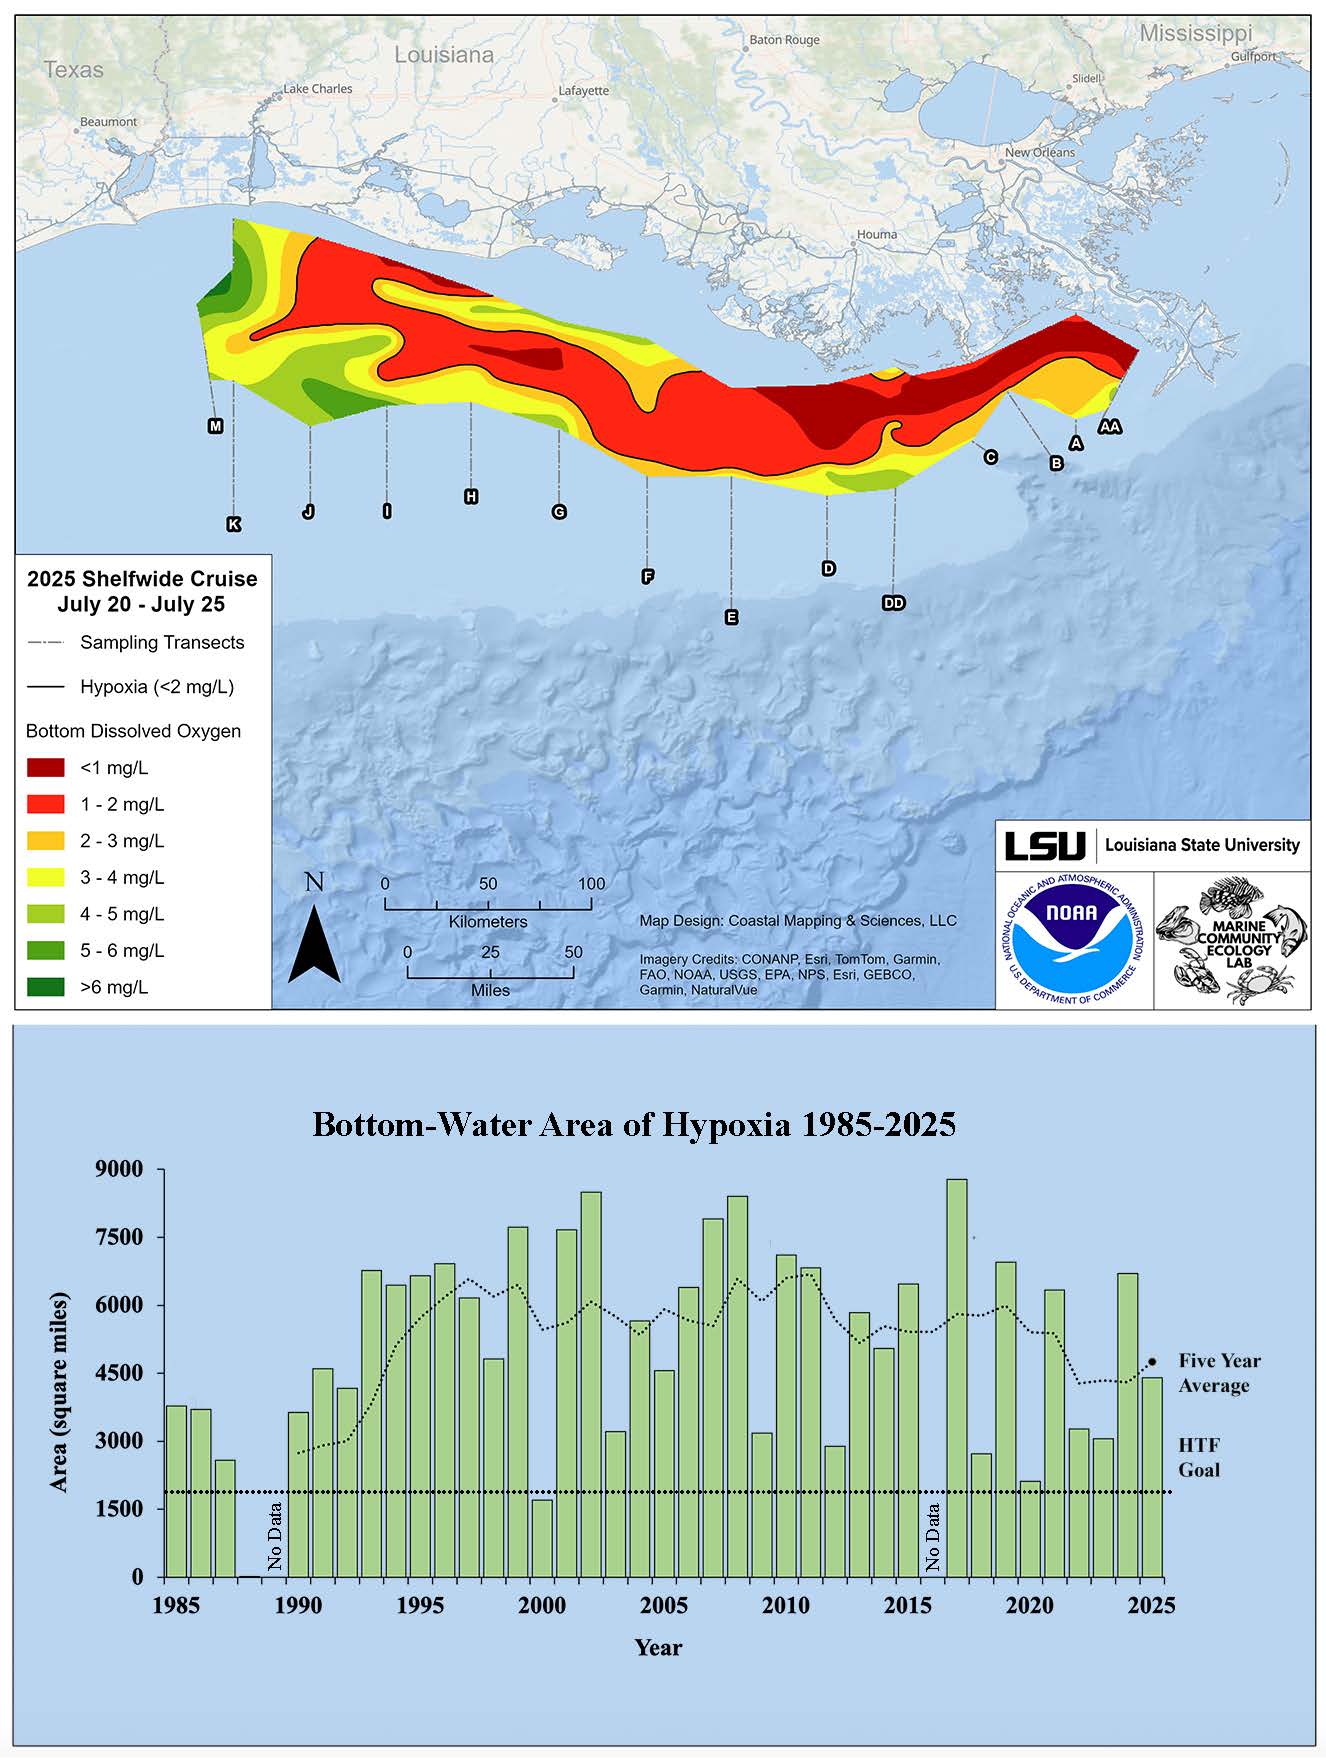
Image showing (Top) Map of measured Gulf hypoxia zone, July 20 – 25, 2025. Red area denotes 2 mg/L of oxygen or lower, the level which is considered hypoxic, at the bottom of the seafloor. (Bottom) Long-term measured size of the hypoxic zone (green bars) measured during the ship surveys since 1985, including the target goal established by the Mississippi River/Gulf of America Hypoxia Task Force and the 5-year average measured size (black dashed lines). (Image credit: NOAA/LUMCON/LSU)